
Pulse
Pulse shows conversations, evaluation success, topics, average cost, sentiment, average duration, customer satisfaction, transfers to a human and response time. Use Pulse preferences to focus the last row on inbound or outbound calls. Expand opens the activity summary; Analyze opens Mastermind. The summary is calculated from the selected period. Each chart appears as soon as its data is ready. A slower chart keeps its own loading placeholder while the others remain available. If a chart fails to load, choose Try again to refresh the report. The small chart button on each card opens the corresponding Dashboards tab with the same date range. Reporting covers all branches and includes previews. Changing the editor branch changes Preview’s configuration, not the report’s scope.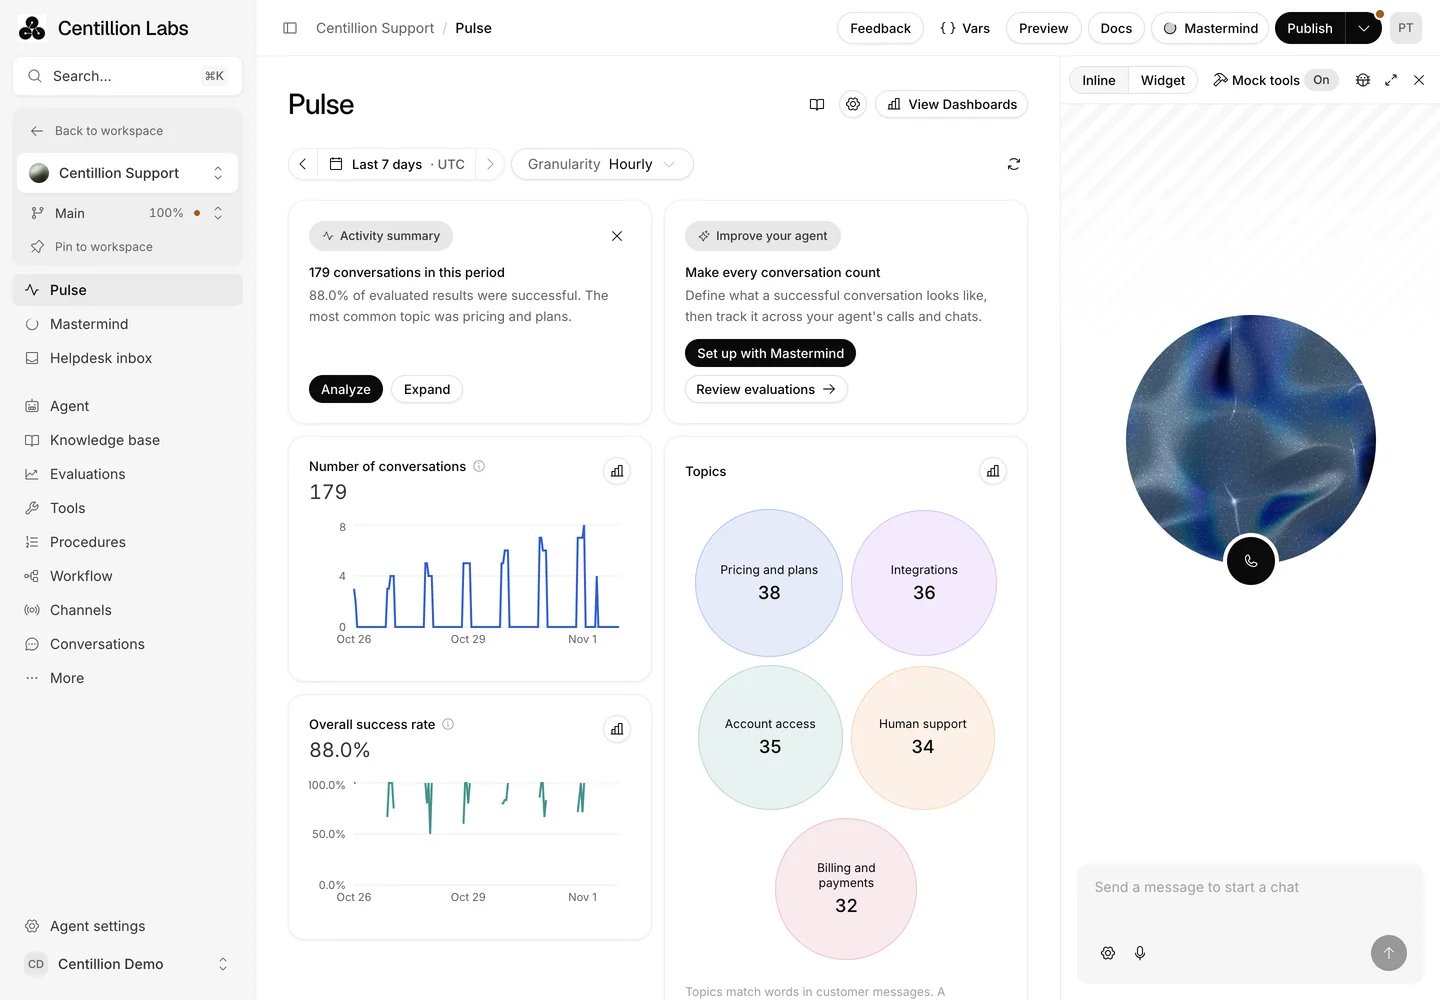
Pulse with the agent's voice and chat Preview open beside its activity summary and charts.
Dashboards
Workspace Home and each agent’s Dashboards use the same reports. The workspace Agent filter narrows them to one agent; an agent’s own Dashboards keeps that agent selected. Before a workspace has activity, Home and Dashboards show labeled fictional charts so you can explore the reports, including on Free. Sample charts never count toward real metrics, credits or billing. Their exports are labeled as sample data. Hide sample data restores your actual reports and plan limits; the choice is remembered for this workspace in your browser, separately from the sample inbox. Real activity replaces the examples automatically. Choosing an empty date range in an active workspace never brings samples back.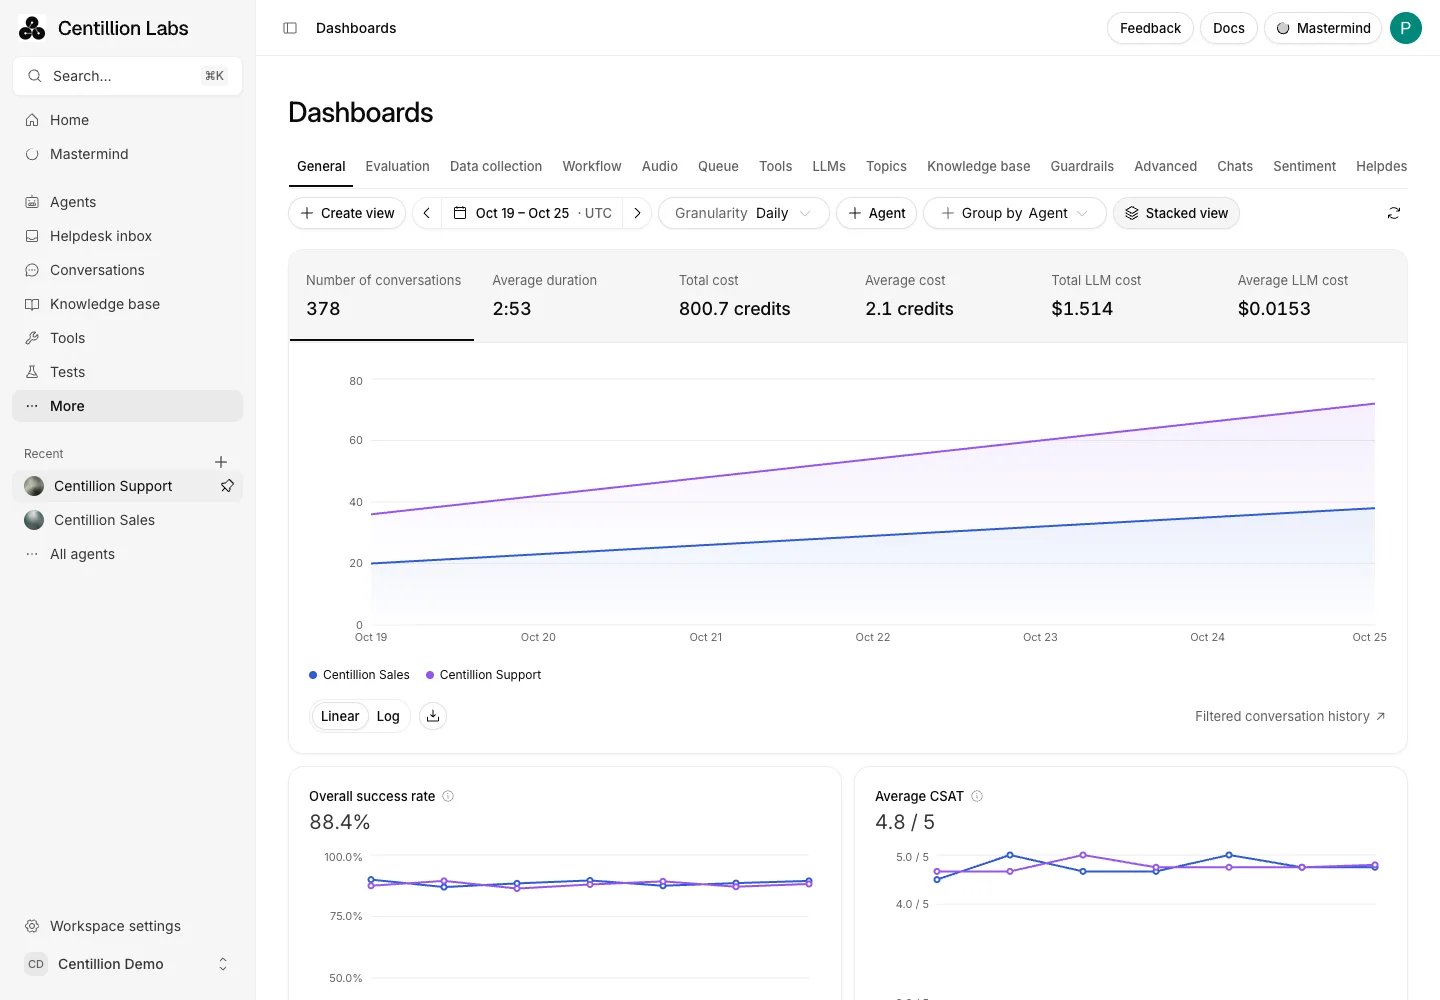
Workspace Dashboards compares the same metrics across agents. Group by Agent and turn on Stacked view to see each agent's contribution.
- General includes conversations, average duration, total and average credit cost, evaluation success, CSAT and response time.
- Evaluation shows overall pass rate, criteria rankings and a trend chart for each recorded criterion. Workflow shows recorded workflow transitions.
- Data collection shows a card for each enabled data point in the agent’s Analysis settings. Switch each card between Bar chart, Line chart and Totals. Text and boolean fields show value counts; numeric fields show averages over time and their sum, minimum and maximum in Totals.
- Audio, Tools and LLMs show recorded timings, executions and usage.
- Topics shows topic bubbles and a table sortable by conversations, sentiment and success. Open Manage topics to edit the agent’s topic list.
- Knowledge base shows source references for complete UTC days in the range. Partial days are excluded because source references are recorded daily.
- Advanced includes agents, languages, channels, countries and call outcomes.
- Chats, Sentiment and Helpdesk keep the existing analytics available. On these tabs for an agent, use the link below the charts to open the detailed report, including the original comparison and team filters.
false and 0
are collected values. Lead and form submissions remain in their activity pages.
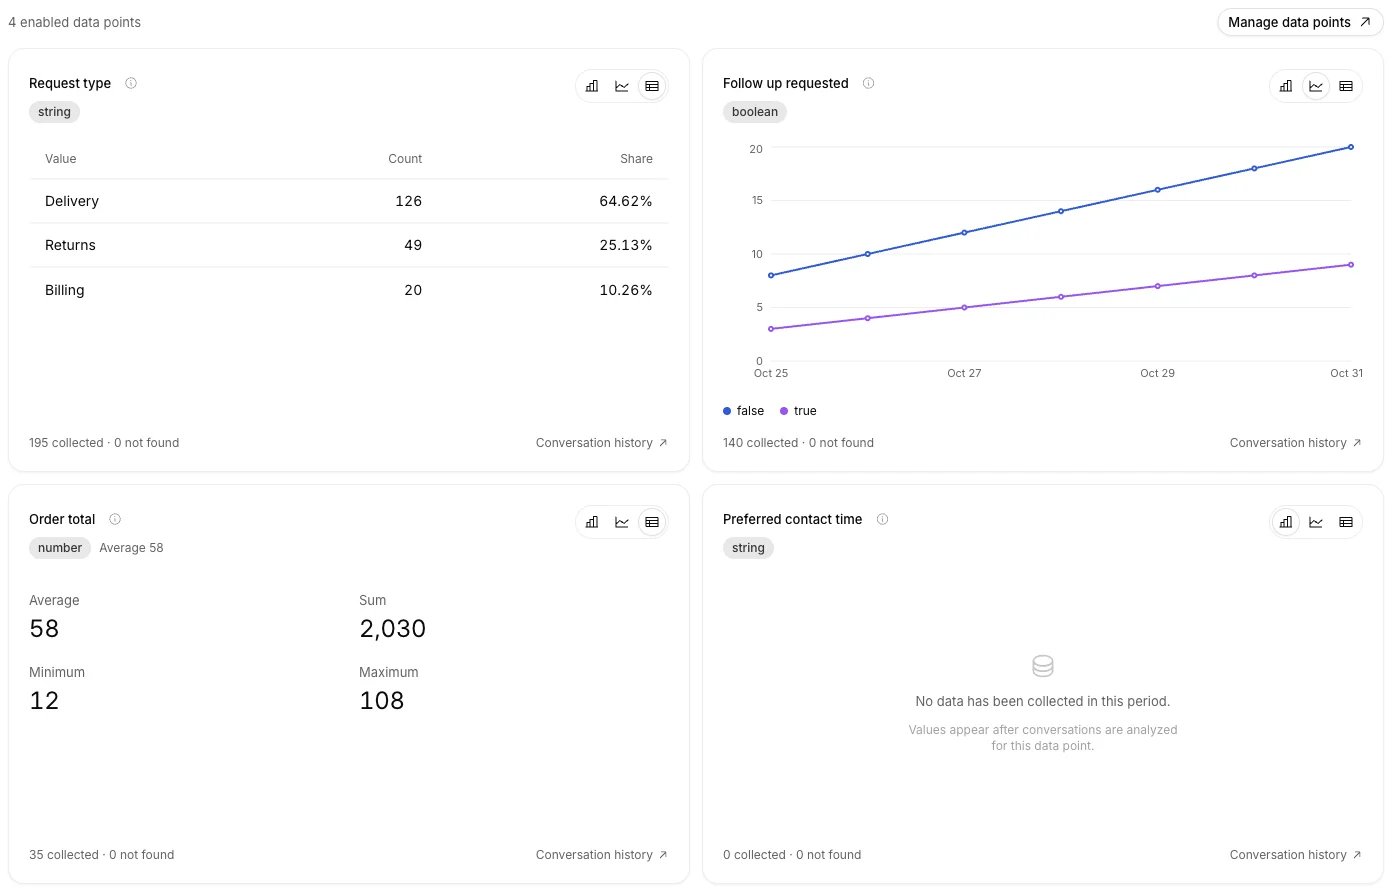
Data collection charts follow the agent's configured fields. These fictional examples show totals, a line chart, numeric summaries and a field waiting for its first result.
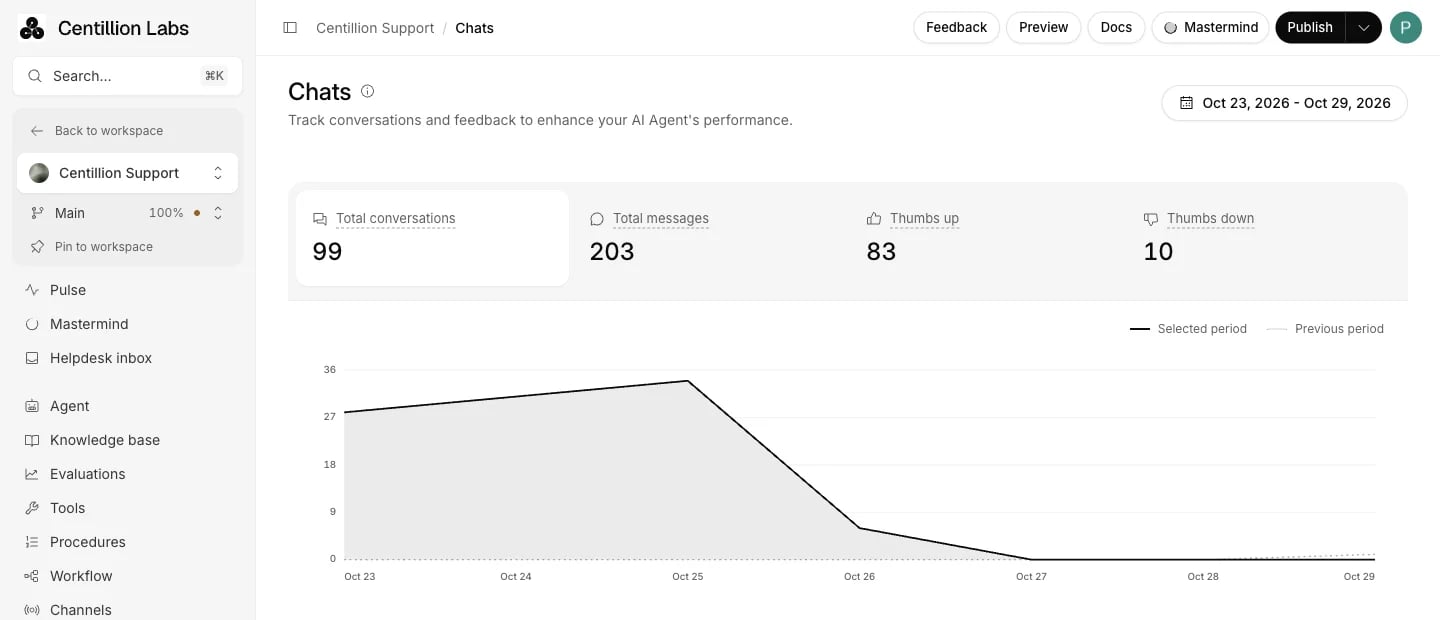
The detailed Chats report includes message feedback and comparison with the previous period.
What you need
- Free includes conversation and message totals for the selected period, plus the number of active conversations. These appear in Home, the workspace Dashboards and Pulse. An agent’s own Dashboards needs Hobby and up.
- Hobby and up for performance charts, breakdowns and detailed Chats and Helpdesk reports. The upgrade offer names the plan that opens the selected report. See plans.
- Pro and up for Topics and Sentiment.
- Helpdesk turned on, Standard and up, for the Helpdesk tab to have tickets to count.
- The Owner, Member or Viewer role to read Dashboards. Owners and Members can change the topic list. See workspace roles.
Set it up
Open Dashboards
Pick a date range
Inspect and compare
Save a view
Use it every day
Detailed Chats
The first card holds Total conversations, Total messages, Thumbs up and Thumbs down. Thumbs count the agent replies your visitors marked as helpful or unhelpful. The second card holds:- Daily active users: unique people who chatted on the last day of the range. The chart shows each day.
- Weekly active users: unique people who chatted in the 7 days up to the last day of the range. The chart shows each day’s 7-day count.
- Stickiness: how many of your weekly users come back each day.
Detailed Helpdesk
The Helpdesk tab tracks ticket volume and how your team answers:- Created tickets, Solved tickets and Unsolved tickets. Unsolved counts open tickets at the end of each day, including older ones.
- Agent replies sent: replies by teammates. AI replies and internal notes do not count.
- Median first response time, Median response time and Median time to close.
- Resolved on first contact rate, for tickets one teammate handled end to end, and Resolved on first reply rate, for tickets closed after exactly one teammate reply.
- Tickets by channel.
Manage topics
The Manage topics page shows themes as a graph or a pie chart, with Total topics. Centillion matches the words in customer messages to each topic. The built-in topics are Pricing and plans, Product information, Account access, Billing and payments, Technical support, Integrations, Shipping and delivery, Returns and cancellations, Sales inquiries and Human support. A conversation that matches none of them adds a topic named after its first meaningful word. Manage opens Manage topics, where you add, rename and remove topics, up to 100. A topic name holds up to 60 characters. A removed topic stays out of the list. Turn on Freeze topics to stop new topics from appearing on their own; existing topics stay active. View all lists every topic with a search box.Detailed Sentiment
Sentiment charts Positive, Negative, Neutral and Unspecified conversations per day. For website chats, Centillion compares positive and negative words in the customer’s messages. For conversations on connected channels, such as WhatsApp or email, sentiment comes from the same reading that churn detection does, so those conversations stay Unspecified until churn detection is on.Ask Mastermind about the numbers
On Pulse, click Analyze on the activity summary, or Analyze with Mastermind in its expanded view. Mastermind opens on the right and starts an analysis for the selected dates. The left sidebar folds to icons to make room; closing Mastermind restores it if it was expanded. The report stays open, and the full-screen control lets you continue the same chat on its own page.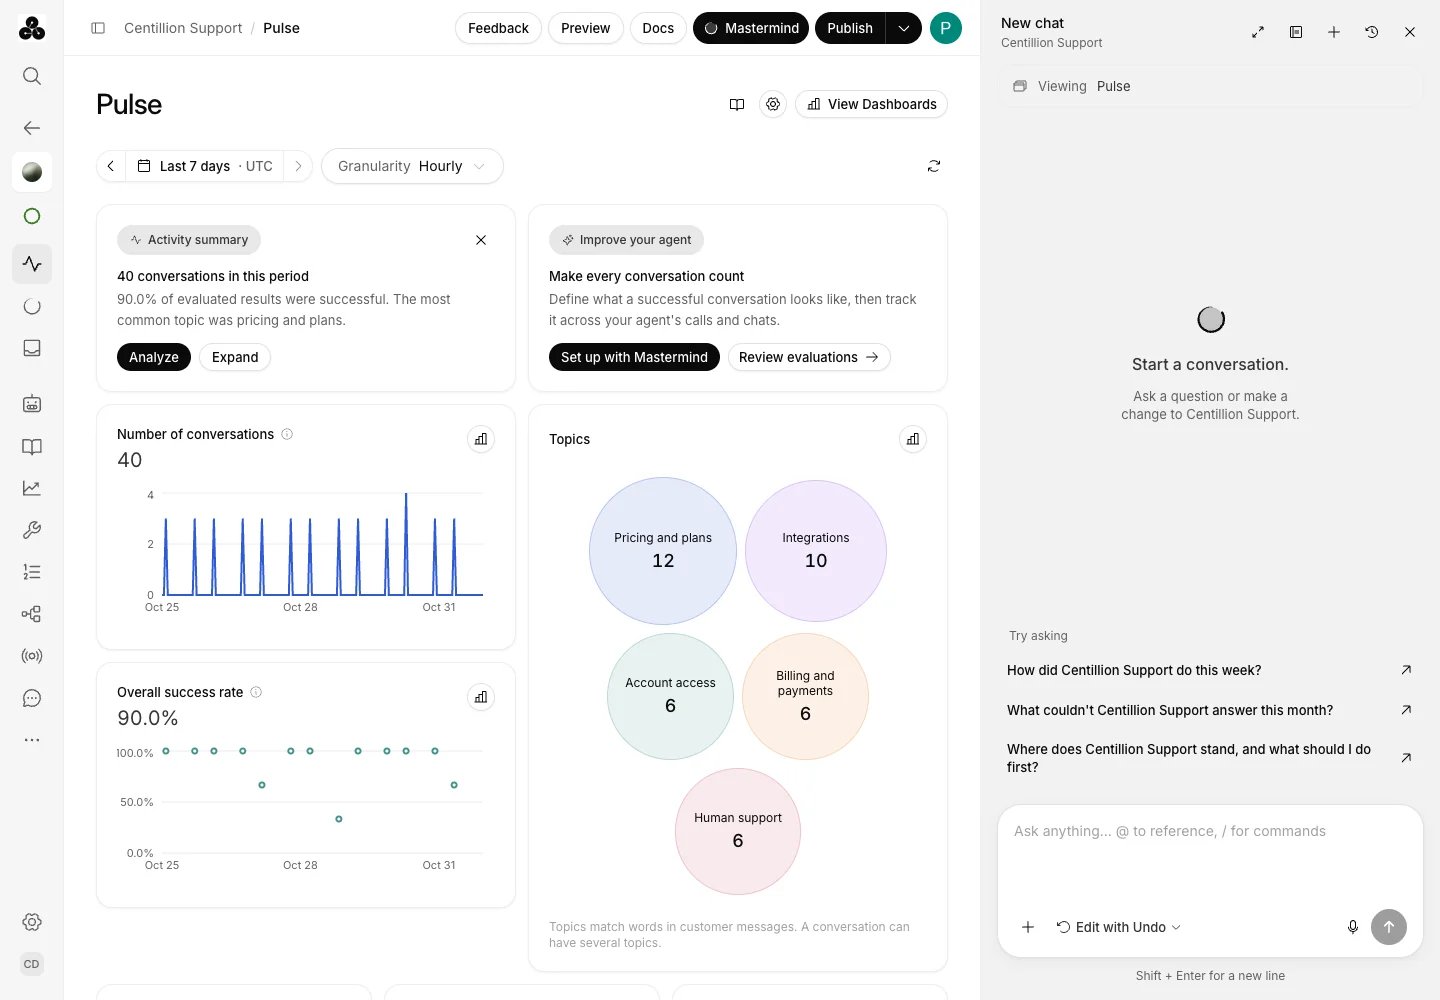
Mastermind beside Pulse, with the left sidebar collapsed to make room for the conversation.
Set up satisfaction and transfers
When CSAT is not configured and there are no ratings, the Average CSAT card offers Set up CSAT surveys, which opens Settings → Helpdesk → CSAT surveys. These are post-ticket surveys. Widget message feedback is reported separately as thumbs up and thumbs down. When transfers are not configured and there are no recorded handoffs, the Transfer to human card offers Set up in Tools, which opens the phone transfer builder. Each card has a book icon in the top right that opens its setup guide. The book beside Pulse’s preferences opens this analytics guide. Charts use a consistent color for each metric. The topics table shows topic descriptions where available, signed sentiment scores, and a success bar for completed evaluations. Click anywhere on a row for its details and matching conversations, newest first. Open a conversation to read its transcript, or use Next and Previous to page through the topic’s conversations. Click a column heading to sort, then click again to reverse the order. Topics without a measurement stay at the bottom in either direction.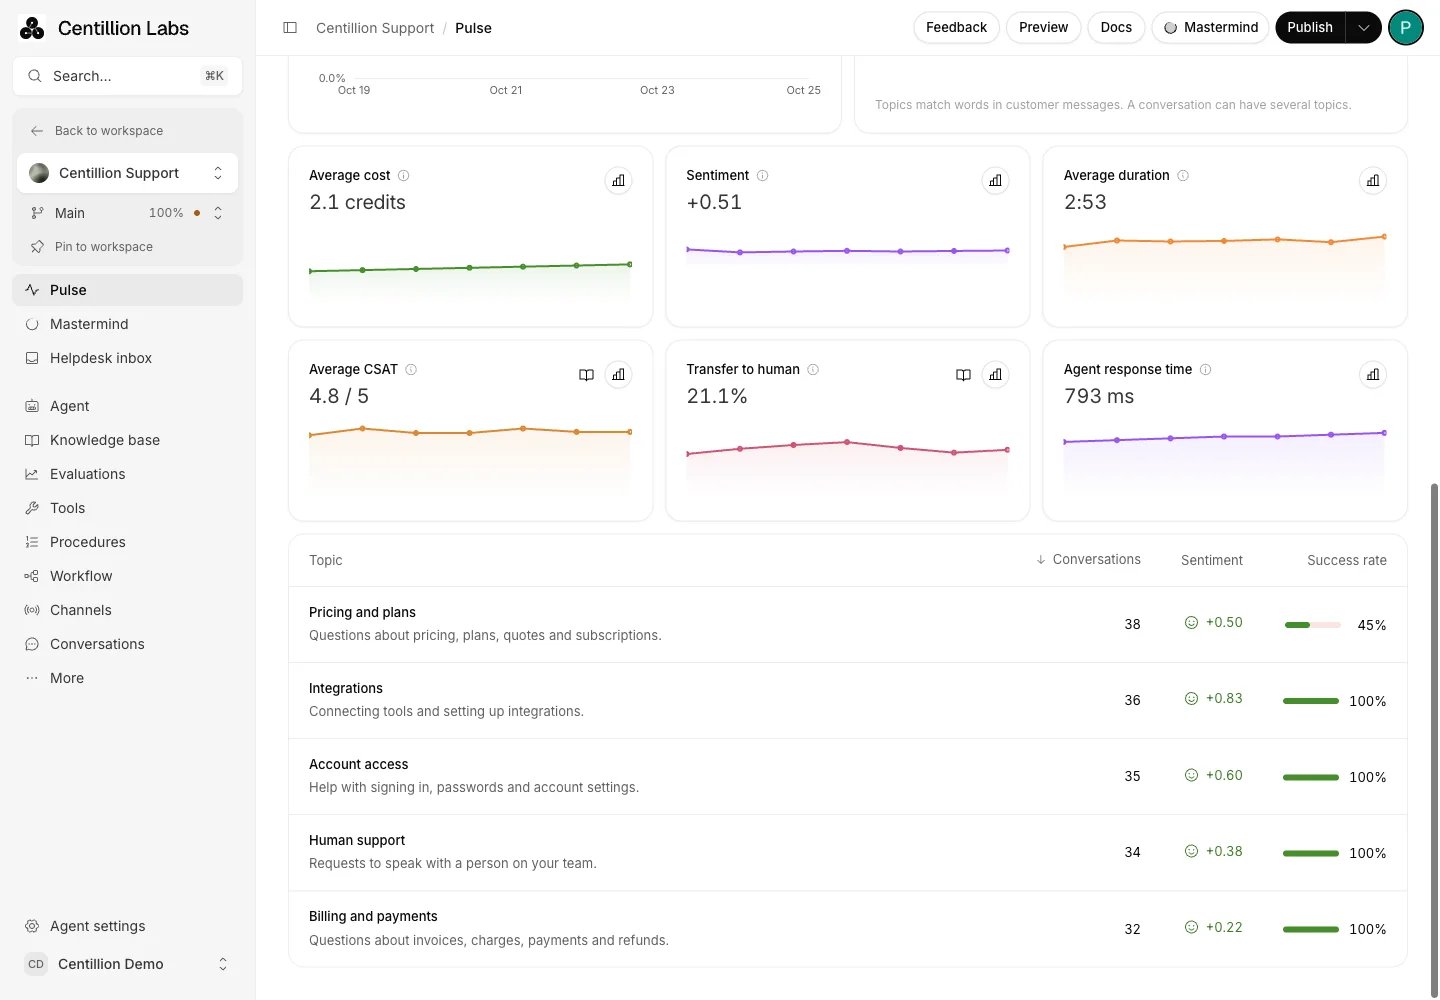
Each metric has its own chart color. The topics table compares conversation volume, sentiment and success.
Evaluation results
Open Dashboards → Evaluation to compare the results of your criteria. The report follows the selected dates and agent, includes previews, and covers all branches. Each conversation contributes its latest recorded evaluation for each criterion. Criteria appear after their first evaluation. Overall pass rate is the share of rated conversations that passed every recorded binary criterion. Any failed binary criterion makes the conversation fail. Without a failure, unknown or unfinished binary results keep it unrated. Conversations with only numeric scores are also unrated. Total conversations shows the rated and unrated counts alongside the total for the period. Use Criteria ranking to compare success rate, failure rate, unknown rate, evaluation count or average score. Select a criterion in the ranking to jump to its chart. Search criteria narrows the cards; All charts lets you hide or restore individual criteria. These choices affect the cards, while the summary and ranking continue to cover all results in the selected period. Each criterion has its own metric selector, outcome counts and CSV download:- Success rate and Failure rate use only completed binary verdicts.
- Unknown rate divides unknown results by all completed evaluations, including numeric scores.
- Evaluations counts all recorded results, including pending evaluations and processing errors.
- Average score normalizes each numeric score to its maximum before averaging. A score of 4 out of 5 contributes 80%. Numeric criteria open on this metric when they have no binary results.
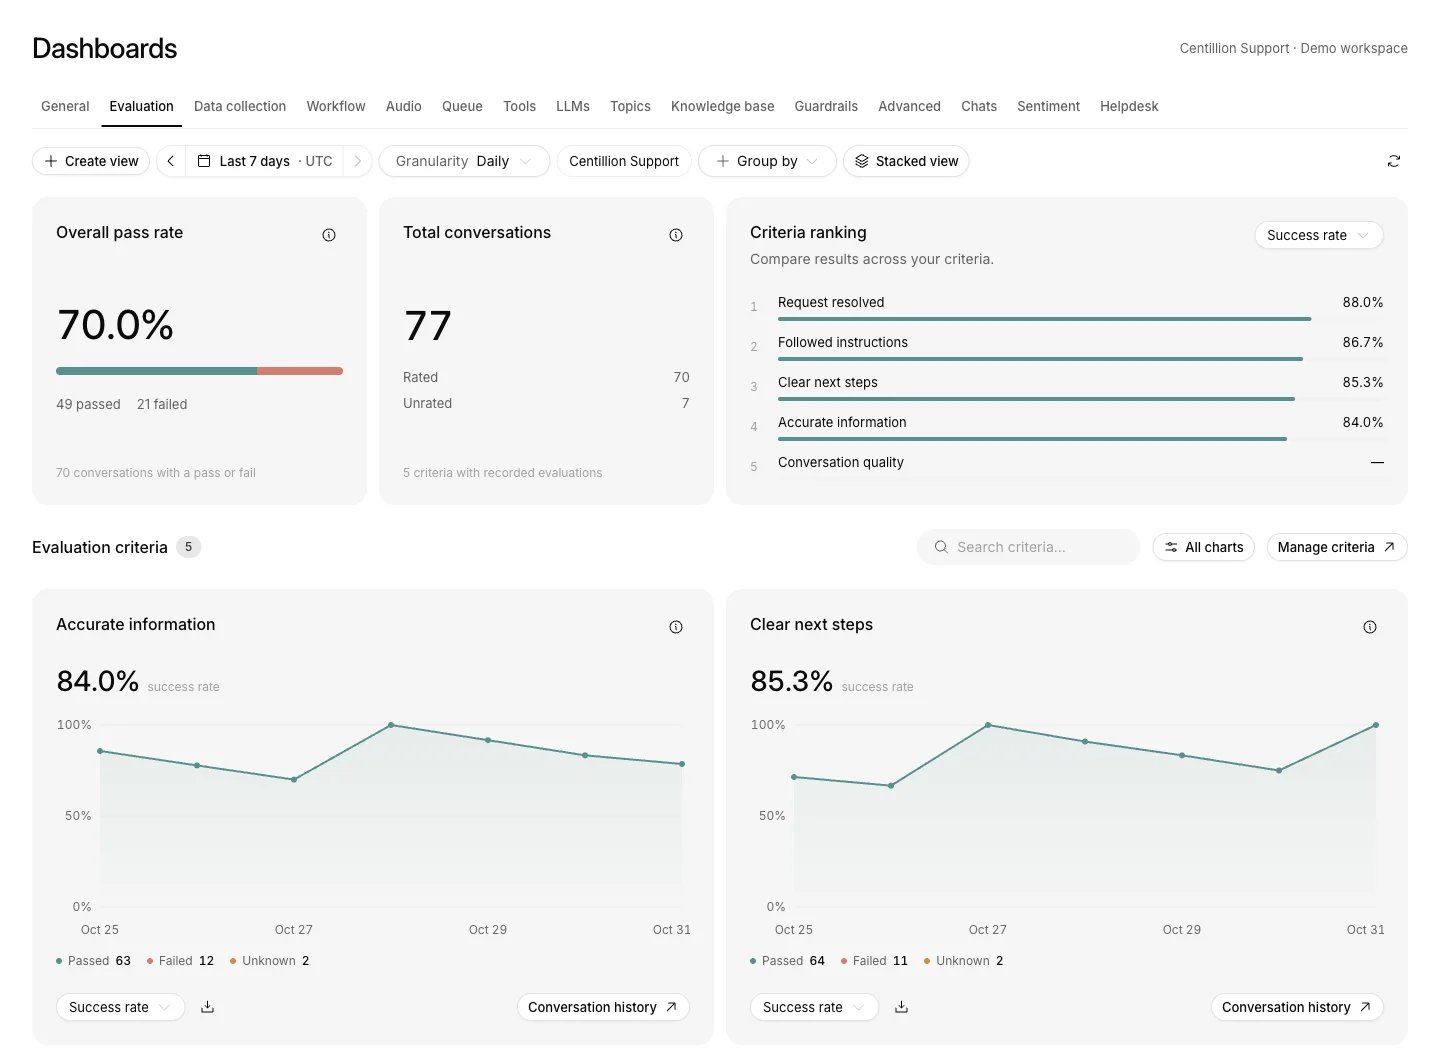
Evaluation results with an overall conversation pass rate, criteria ranking and independent trend charts. The figures shown are fictional demo data.
Limits and good to know
- Pulse and Dashboards aggregate all matching conversations in the selected range, up to one year. The older detailed Chats, topic management and Sentiment pages read the agent’s 100 most recently updated conversations.
- Duration includes completed conversations. The success metric in General and Pulse averages completed binary verdicts and numeric scores normalized to their maximum: success contributes 100%, failure 0%, and a score of 4 out of 5 contributes 80%. Unknown, pending and failed evaluations are excluded. Sentiment averages classified conversations from -1 to +1. CSAT averages survey ratings out of five, with thumbs up counted as five and thumbs down as one.
- Credit costs include committed test usage.
- Pulse and Dashboards include discovered topics alongside keyword matches and use completed conversation analysis for sentiment when available. Without analysis, existing sentiment classifications and keyword matches remain. A conversation can count toward more than one topic.
- Messaging-channel sentiment comes from conversation analysis or churn detection.
- Helpdesk figures are in UTC and leave out AI replies and internal notes from teammate metrics.
- Topics and Sentiment need Pro and up; the other reporting charts need Hobby and up. Basic activity totals remain available on Free.